【Tableau】Tableau Desktop Certified Associate受験

[スポンサーリンク]


Tableau Desktop Certified Associate受験


Tableaue Desktop Certified Associat受験しました

Tableaue Desktop Certified Associatは、Tableau社の認定資格です
以前受けたTableau Desktop Specialistの上位資格です
今回の受験時点では、資格についてはSpecialist受験時に記録した下記の記事と大きく変わっていません

【Tableaue】Tableau Desktop Specialist受験
Tableau Desktop Specialist受験Tableau Desktop Specialist受験しましたまた、機会があれば次のグレードの試験も挑戦してみたいので、受験方法などについて記録してお...

受験方法についても、Specialist受験時と同じです
下記に記録している内容で、問題なく受験することが出来ます

【Tableaue】Tableau Desktop Specialist受験
Tableau Desktop Specialist受験Tableau Desktop Specialist受験しましたまた、機会があれば次のグレードの試験も挑戦してみたいので、受験方法などについて記録してお...

[スポンサーリンク]


Tableaue Desktop Certified Associate勉強方法


Tableau Desktop Specialist受験時には、e-learningの無料キャンペーン中だったので、それで学習しました
但し、今回の受験タイミングではキャンペーンは終わっていました

なので、以下のTableau社の無料の学習コンテンツで学習をしました
・無料トレーニングビデオ
・オンラインヘルプ

試験準備ガイド記載の評価スキルを基準に、参考になるコンテンツを参照、操作をして学習しました

Desktop Certied Associate 試験ガイド
https://mkt.tableau.com/files/DesktopCA_ExamGuide_ja-JP.pdf

Tableau Desktop を実際に操作する


Tableau Desktopは2週間の試用期間が認められています
今回はその2週間の試用期間を利用させて戴き、学習させて戴きました

インストーラーは下記サイトで各バージョンが公開されています

Tableau Desktop

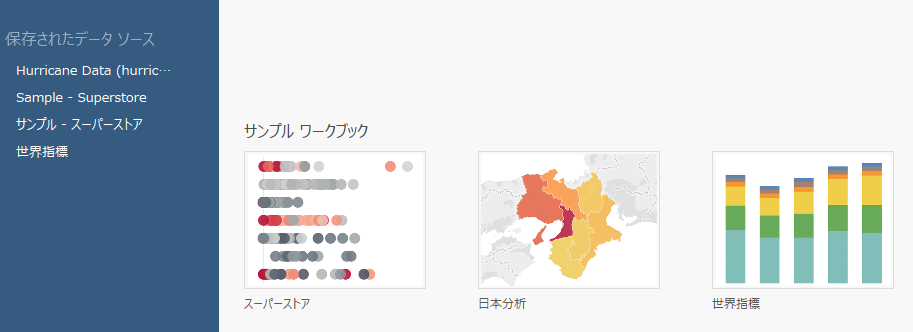
Tableau Desktopには最初にサンプルのデータとワークブックがついています
地図以外の操作を試すにはスーパーストアのデータ
地図の操作を試すには世界指標のデータ
を使うことで、後述のオンラインヘルプの動作を実際に試すことが出来ます

データソースは既定のままインストールした場合は、下記に保存されています
C:\Users\【ユーザ名】\Documents\マイ Tableau リポジトリ\データ ソース\【バージョン】\ja_JP-Japan


無料トレーニングビデオ


Tableau社が公開している無料トレーニングビデオです

ただ英語版のみの公開も多いです
英語版でも動画で操作が見れるので、動画を見ながら操作を実際にすればある程度理解出来ると思います
私は英語が苦手且つ、時間が取れなかったので英語版はスキップしました

Free Training Videos - 2023.1

評価されるスキルと動画のマッピングを記録します
※マッピング誤りや記載漏れ等が沢山あると思います

データ接続 – 17%
・Tableau Server に接続する
・接続オプションを説明する
・異なるデータソースタイプに接続する 入門 https://www.tableau.com/ja-jp/learn/tutorials/on-demand/getting-started
テキストファイルや Excel ファイルを使用したデータ準備 https://www.tableau.com/ja-jp/learn/tutorials/on-demand/data-prep-text-and-excel-files
・1 つおよび複数のデータベースから表を結合する テキストファイルや Excel ファイルを使用したデータ準備 https://www.tableau.com/ja-jp/learn/tutorials/on-demand/data-prep-text-and-excel-files
クロスデータベース結合 https://www.tableau.com/ja-jp/learn/tutorials/on-demand/cross-database-joins
・分析のためにデータを準備する ・ブレンディング データブレンディング https://www.tableau.com/ja-jp/learn/tutorials/on-demand/data-blending
その他のデータブレンディングに関するトピック https://www.tableau.com/ja-jp/learn/tutorials/on-demand/additional-data-blending-topics
・メタデータグリッド テキストファイルや Excel ファイルを使用したデータ準備 https://www.tableau.com/ja-jp/learn/tutorials/on-demand/data-prep-text-and-excel-files
・ピボット テキストファイルや Excel ファイルを使用したデータ準備 https://www.tableau.com/ja-jp/learn/tutorials/on-demand/data-prep-text-and-excel-files
・ユニオン 結合タイプとユニオン https://www.tableau.com/ja-jp/learn/tutorials/on-demand/join-types-union
・データインタープリター テキストファイルや Excel ファイルを使用したデータ準備 https://www.tableau.com/ja-jp/learn/tutorials/on-demand/data-prep-text-and-excel-files
・抽出の形式と機能を説明する 抽出の管理 https://www.tableau.com/ja-jp/learn/tutorials/on-demand/managing-extracts
・複数の表で抽出を作成する
・ブレンド、結合、およびクロスデータベース結合に関するパフォーマンス上の考慮事項を説明する
・自動分割とカスタム分割を使用する テキストファイルや Excel ファイルを使用したデータ準備 https://www.tableau.com/ja-jp/learn/tutorials/on-demand/data-prep-text-and-excel-files
データの構成と簡素化 – 10%
・以下の方法を理解する ・データのフィルター フィルタリングの方法 https://www.tableau.com/ja-jp/learn/tutorials/on-demand/ways-filter
[フィルター] シェルフの使用 https://www.tableau.com/ja-jp/learn/tutorials/on-demand/using-filter-shelf
インタラクティブフィルター https://www.tableau.com/ja-jp/learn/tutorials/on-demand/interactive-filters
・データの並べ替え 入門 https://www.tableau.com/ja-jp/learn/tutorials/on-demand/getting-started
・グループの作成 グループ化 https://www.tableau.com/ja-jp/learn/tutorials/on-demand/grouping
Additional Ways to Group https://www.tableau.com/ja-jp/learn/tutorials/on-demand/additional-ways-group
・階層の作成 入門 https://www.tableau.com/ja-jp/learn/tutorials/on-demand/getting-started
・セットの作成 セットの作成 https://www.tableau.com/ja-jp/learn/tutorials/on-demand/creating-sets
セットの操作 https://www.tableau.com/ja-jp/learn/tutorials/on-demand/working-sets
フィールドとチャートのタイプ – 15%
・メジャーとディメンションの違いを説明する フィールドタイプについて https://www.tableau.com/ja-jp/learn/tutorials/on-demand/understanding-pill-types
・不連続フィールドと連続フィールドの違いを説明する フィールドタイプについて https://www.tableau.com/ja-jp/learn/tutorials/on-demand/understanding-pill-types
・Tableau 生成フィールドの使用方法を説明する
・以下を作成する方法とその使用場面を理解する ・ヒストグラム
・ヒートマップ
・ツリーマップ
・ブレットグラフ
・複合軸グラフ
・二重軸グラフ
・散布図
・クロス集計 入門 https://www.tableau.com/ja-jp/learn/tutorials/on-demand/getting-started
・Bar in Bar グラフ
・箱ヒゲ図 リファレンスライン https://www.tableau.com/ja-jp/learn/tutorials/on-demand/reference-lines
・タイトル、キャプション、およびツールヒントを効果的に使用する 入門 https://www.tableau.com/ja-jp/learn/tutorials/on-demand/getting-started
書式設定 https://www.tableau.com/ja-jp/learn/tutorials/on-demand/formatting
基本的なツールヒント https://www.tableau.com/ja-jp/learn/tutorials/on-demand/tooltips
・軸を編集する 書式設定 https://www.tableau.com/ja-jp/learn/tutorials/on-demand/formatting
・マークラベルと注釈を使用する 書式設定 https://www.tableau.com/ja-jp/learn/tutorials/on-demand/formatting
計算 – 18%
・以下の方法を理解する ・文字列操作と日付計算
・簡易表計算の作成 表計算入門 https://www.tableau.com/ja-jp/learn/tutorials/on-demand/intro-table-calculations
・詳細レベル (LOD) 表現の使用 LOD 表現入門 https://www.tableau.com/ja-jp/learn/tutorials/on-demand/introduction-lod-expressions
・さまざまなタイプの LOD 表現の説明
・アドホック計算の使用
・集計オプションの操作
・論理ステートメントの作成
・算術計算の作成
・総計と小計の作成
・結合句における計算の使用
マッピング – 13%
・次の機能を使用してマップをナビゲーションする ・パンとズーム
・フィルター
・マップレイヤー 書式設定 https://www.tableau.com/ja-jp/learn/tutorials/on-demand/formatting
・地域区分のカスタマイズ
・投げ縄選択と円形選択 入門 https://www.tableau.com/ja-jp/learn/tutorials/on-demand/getting-started
・地理検索
・Tableau で場所を修正する
・カスタムジオコーデイングをインポートおよび管理する
・背景イメージマップを使用する
・空間ファイルに接続する
・ヒートマップを作成する
分析 – 15%
・ビジュアル分析で以下を使用する ・リファレンスライン リファレンスライン https://www.tableau.com/ja-jp/learn/tutorials/on-demand/reference-lines
・リファレンスバンド リファレンスライン https://www.tableau.com/ja-jp/learn/tutorials/on-demand/reference-lines
・傾向線 傾向線 https://www.tableau.com/ja-jp/learn/tutorials/on-demand/trend-lines
・傾向モデル
・予測 予測 https://www.tableau.com/ja-jp/learn/tutorials/on-demand/forecasting
・ドラッグ & ドロップ分析
・箱ヒゲ図 リファレンスライン https://www.tableau.com/ja-jp/learn/tutorials/on-demand/reference-lines
・リファレンス分布 リファレンスライン https://www.tableau.com/ja-jp/learn/tutorials/on-demand/reference-lines
・統計サマリーカード
・インスタント分析
・データハイライター アクションを使用したダッシュボードのインタラクティブ性 https://www.tableau.com/ja-jp/learn/tutorials/on-demand/dashboard-interactivity-using-actions
ダッシュボード – 12%
・ダッシュボードおよびストーリーを構築する ダッシュボードの作成 https://www.tableau.com/ja-jp/learn/tutorials/on-demand/building-dashboard
・ダッシュボードアクションを作成する アクションを使用したダッシュボードのインタラクティブ性 https://www.tableau.com/ja-jp/learn/tutorials/on-demand/dashboard-interactivity-using-actions
・デバイスでの表示を考慮してダッシュボードをデザインする デバイスデザイナー https://www.tableau.com/ja-jp/learn/tutorials/on-demand/device-designer
・デバイスでの表示に関するビジュアルベストプラクティスを使用する デバイスデザイナー https://www.tableau.com/ja-jp/learn/tutorials/on-demand/device-designer
・パブリッシュと共有のオプションを説明する 配信とパブリッシュ https://www.tableau.com/ja-jp/learn/tutorials/on-demand/distributing-and-publishing
Tableau Online へのパブリッシュ https://www.tableau.com/ja-jp/learn/tutorials/on-demand/publishing-tableau-online
Tableau Server へのパブリッシュ https://www.tableau.com/ja-jp/learn/tutorials/on-demand/publishing-tableau-server

オンラインヘルプ


Tableau社が公開しているオンラインヘルプです

試験中にもTableDesktopのヘルプから参照可能です
ただ日本語入力が出来ない(?)ので、オンラインヘルプのどのあたりに欲しい情報の記載があるかは抑えておくと時間短縮出来ます

Tableau Desktop と Web 作成のヘルプ
Tableau Help.

評価されるスキルと動画のオンラインヘルプを記録します
※マッピング誤りや記載漏れ等が沢山あると思います

データ接続 – 17%
・Tableau Server に接続する Tableau Server または Tableau Online を使用したデータへの接続 https://help.tableau.com/current/pro/desktop/ja-jp/examples_tableauserver.htm
・接続オプションを説明する データへの接続 https://help.tableau.com/current/pro/desktop/ja-jp/basicconnectoverview.htm
・異なるデータソースタイプに接続する データの結合 https://help.tableau.com/current/pro/desktop/ja-jp/joining_tables.htm
・1 つおよび複数のデータベースから表を結合する データの結合 https://help.tableau.com/current/pro/desktop/ja-jp/joining_tables.htm
・分析のためにデータを準備する ・ブレンディング データのブレンド https://help.tableau.com/current/pro/desktop/ja-jp/multiple_connections.htm
・メタデータグリッド [データ ソース] ページ https://help.tableau.com/v2020.1/pro/desktop/ja-jp/environment_datasource_page.htm
・ピボット ピボット データ ([列] から [行]) https://help.tableau.com/current/pro/desktop/ja-jp/pivot.htm
・ユニオン データのユニオン作成 https://help.tableau.com/current/pro/desktop/ja-jp/union.htm
・データインタープリター Excel、CSV、PDF、および Google スプレッドシートからのデータインタープリターを使用するデータのクリーニング https://help.tableau.com/v2020.1/pro/desktop/ja-jp/data_interpreter.htm
・抽出の形式と機能を説明する データの抽出 https://help.tableau.com/v2020.1/pro/desktop/ja-jp/extracting_data.htm
・複数の表で抽出を作成する データの抽出 https://help.tableau.com/v2020.1/pro/desktop/ja-jp/extracting_data.htm
・ブレンド、結合、およびクロスデータベース結合に関するパフォーマンス上の考慮事項を説明する 効率的なデータ ソースの組み合わせを作成する https://help.tableau.com/current/pro/desktop/ja-jp/perf_join_blend.htm
・自動分割とカスタム分割を使用する フィールドを複数フィールドに分割 https://help.tableau.com/current/pro/desktop/ja-jp/split.htm
データの構成と簡素化 – 10%
・以下の方法を理解する ・データのフィルター ビューからのデータのフィルター https://help.tableau.com/current/pro/desktop/ja-jp/filtering.htm
・データの並べ替え 視覚化内でのデータの並べ替え https://help.tableau.com/current/pro/desktop/ja-jp/sortgroup_sorting_computed_howto.htm
・グループの作成 データのグループ化 https://help.tableau.com/current/pro/desktop/ja-jp/sortgroup_groups_creating.htm
・階層の作成 階層の作成 https://help.tableau.com/current/pro/desktop/ja-jp/qs_hierarchies.htm
・セットの作成 セットの作成 https://help.tableau.com/current/pro/desktop/ja-jp/sortgroup_sets_create.htm
フィールドとチャートのタイプ – 15%
・メジャーとディメンションの違いを説明する ディメンションとメジャー、青と緑 https://help.tableau.com/current/pro/desktop/ja-jp/datafields_typesandroles.htm
・不連続フィールドと連続フィールドの違いを説明する ディメンションとメジャー、青と緑 https://help.tableau.com/current/pro/desktop/ja-jp/datafields_typesandroles.htm
・Tableau 生成フィールドの使用方法を説明する メジャー バリューとメジャー ネーム https://help.tableau.com/current/pro/desktop/ja-jp/datafields_understanddatawindow_meavalues.htm
・以下を作成する方法とその使用場面を理解する ・ヒストグラム 最適なチャート/グラフを選択する方法 https://www.tableau.com/sites/default/files/whitepapers/which_chart_or_graph_is_right_for_youwp_ja-jp.pdf
・ヒートマップ 最適なチャート/グラフを選択する方法 https://www.tableau.com/sites/default/files/whitepapers/which_chart_or_graph_is_right_for_youwp_ja-jp.pdf
・ツリーマップ 最適なチャート/グラフを選択する方法 https://www.tableau.com/sites/default/files/whitepapers/which_chart_or_graph_is_right_for_youwp_ja-jp.pdf
・ブレットグラフ 最適なチャート/グラフを選択する方法 https://www.tableau.com/sites/default/files/whitepapers/which_chart_or_graph_is_right_for_youwp_ja-jp.pdf
・複合軸グラフ 複合グラフの作成 https://help.tableau.com/current/pro/desktop/ja-jp/qs_combo_charts.htm
・二重軸グラフ ビュー内で複数のメジャーに軸を追加する https://help.tableau.com/current/pro/desktop/ja-jp/multiple_measures.htm
・散布図 最適なチャート/グラフを選択する方法 https://www.tableau.com/sites/default/files/whitepapers/which_chart_or_graph_is_right_for_youwp_ja-jp.pdf
・クロス集計 テキスト テーブルの作成 https://help.tableau.com/current/pro/desktop/ja-jp/buildexamples_text.htm
・Bar in Bar グラフ 重ねて表示する棒グラフの作成 https://kb.tableau.com/articles/howto/dual-axis-bar-chart-multiple-measures?lang=ja-jp
・箱ヒゲ図 最適なチャート/グラフを選択する方法 https://www.tableau.com/sites/default/files/whitepapers/which_chart_or_graph_is_right_for_youwp_ja-jp.pdf
・タイトル、キャプション、およびツールヒントを効果的に使用する タイトル、キャプション、ツールヒントおよび凡例の書式設定 https://help.tableau.com/current/pro/desktop/ja-jp/formatting_specific_titlecaption.htm
・軸を編集する 軸の編集 https://help.tableau.com/current/pro/desktop/ja-jp/formatting_editaxes.htm
・マークラベルと注釈を使用する マーク ラベルの表示、非表示、および書式設定 https://help.tableau.com/current/pro/desktop/ja-jp/annotations_marklabels_showhideworksheet.htm
計算 – 18%
・以下の方法を理解する ・文字列操作と日付計算 文字列関数 https://help.tableau.com/current/pro/desktop/ja-jp/functions_functions_string.htm
・簡易表計算の作成 簡易表計算 https://help.tableau.com/current/pro/desktop/ja-jp/calculations_tablecalculations_quick.htm
・詳細レベル (LOD) 表現の使用 Tableau での詳細レベルの式の作成 https://help.tableau.com/current/pro/desktop/ja-jp/calculations_calculatedfields_lod.htm
・さまざまなタイプの LOD 表現の説明 FIXED 詳細レベルの式 https://help.tableau.com/current/pro/desktop/ja-jp/calculations_calculatedfields_lod_fixed.htm
・アドホック計算の使用 アドホック計算 https://help.tableau.com/current/pro/desktop/ja-jp/calculations_calculatedfields_adhoc.htm
・集計オプションの操作 Tableau でのデータ集計 https://help.tableau.com/current/pro/desktop/ja-jp/calculations_aggregation.htm
・論理ステートメントの作成 論理関数 https://help.tableau.com/current/pro/desktop/ja-jp/functions_functions_logical.htm
・算術計算の作成 簡単な計算フィールドの作成 https://help.tableau.com/current/pro/desktop/ja-jp/calculations_calculatedfields_formulas.htm
・総計と小計の作成 ビジュアライゼーションでの合計の表示 https://help.tableau.com/current/pro/desktop/ja-jp/calculations_totals_grandtotal_turnon.htm
・結合句における計算の使用 データの結合 https://help.tableau.com/current/pro/desktop/ja-jp/joining_tables.htm
マッピング – 13%
・次の機能を使用してマップをナビゲーションする ・パンとズーム ビューのズームとパン、マークの選択 https://help.tableau.com/current/pro/desktop/ja-jp/inspectdata_pan_zoom.htm
・フィルター Tableau のマップ機能でデータを賢く視覚化する方法 https://www.tableau.com/ja-jp/about/blog/2017/6/how-answer-your-data-questions-map-tableau-71865
・マップレイヤー マップの外観のカスタマイズ https://help.tableau.com/current/pro/desktop/ja-jp/maps_options.htm
・地域区分のカスタマイズ マップで領域を作成する https://help.tableau.com/current/pro/desktop/ja-jp/maps_custom_territories.htm
・投げ縄選択と円形選択 ビューのズームとパン、マークの選択 https://help.tableau.com/current/pro/desktop/ja-jp/inspectdata_pan_zoom.htm
・地理検索 マップ内の場所の検索 https://help.tableau.com/current/pro/desktop/ja-jp/maps_mapsearch.htm
・Tableau で場所を修正する 不明な場所またはあいまいな場所の編集 https://help.tableau.com/current/pro/desktop/ja-jp/maps_editlocation.htm
・カスタムジオコーデイングをインポートおよび管理する Tableau が認識しない場所をジオコーディングし、マップ上にプロットする https://help.tableau.com/current/pro/desktop/ja-jp/custom_geocoding.htm
・背景イメージマップを使用する ビューで背景イメージを使用する https://help.tableau.com/current/pro/desktop/ja-jp/bkimages.htm
・空間ファイルに接続する 空間ファイルから Tableau マップを作成する https://help.tableau.com/current/pro/desktop/ja-jp/maps_shapefiles.htm
・ヒートマップを作成する Tableau での傾向や密度を表示するヒートマップの作成 https://help.tableau.com/current/pro/desktop/ja-jp/maps_howto_heatmap.htm
分析 – 15%
・ビジュアル分析で以下を使用する ・リファレンスライン リファレンス ライン、リファレンス バンド、リファレンス分布、およびリファレンス ボックス https://help.tableau.com/current/pro/desktop/ja-jp/reference_lines.htm
・リファレンスバンド リファレンス ライン、リファレンス バンド、リファレンス分布、およびリファレンス ボックス https://help.tableau.com/current/pro/desktop/ja-jp/reference_lines.htm
・傾向線 ビジュアライゼーションへの傾向線の追加 https://help.tableau.com/current/pro/desktop/ja-jp/trendlines_add.htm
・傾向モデル ビジュアライゼーションへの傾向線の追加 https://help.tableau.com/current/pro/desktop/ja-jp/trendlines_add.htm
・予測 予測モデリング https://help.tableau.com/current/pro/desktop/ja-jp/predictions.htm
・ドラッグ & ドロップ分析 流れるような分析 https://www.tableau.com/ja-jp/about/blog/2015/1/analytics-flow-36387
・箱ヒゲ図 ボックス プロットの作成 https://help.tableau.com/current/pro/desktop/ja-jp/buildexamples_boxplot.htm
・リファレンス分布 リファレンス ライン、リファレンス バンド、リファレンス分布、およびリファレンス ボックス https://help.tableau.com/current/pro/desktop/ja-jp/reference_lines.htm
・統計サマリーカード サマリー カード https://help.tableau.com/current/pro/desktop/ja-jp/inspectdata_summary.htm
・インスタント分析 流れるような分析 https://www.tableau.com/ja-jp/about/blog/2015/1/analytics-flow-36387
・データハイライター ハイライト アクション https://help.tableau.com/current/pro/desktop/ja-jp/actions_highlight.htm
ダッシュボード – 12%
・ダッシュボードおよびストーリーを構築する ダッシュボード https://help.tableau.com/current/pro/desktop/ja-jp/dashboards.htm
・ダッシュボードアクションを作成する アクションとダッシュボード https://help.tableau.com/current/pro/desktop/ja-jp/actions_dashboards.htm
・デバイスでの表示を考慮してダッシュボードをデザインする 異なるデバイス タイプのダッシュボード レイアウトの作成 https://help.tableau.com/current/pro/desktop/ja-jp/dashboards_dsd_create.htm
・デバイスでの表示に関するビジュアルベストプラクティスを使用する 異なるデバイス タイプのダッシュボード レイアウトの作成 https://help.tableau.com/current/pro/desktop/ja-jp/dashboards_dsd_create.htm
・パブリッシュと共有のオプションを説明する データ ソースとワークブックのパブリッシュ https://help.tableau.com/current/pro/desktop/ja-jp/publish_overview.htm

[スポンサーリンク]


Tableaue Desktop Certified Associatet受験結果
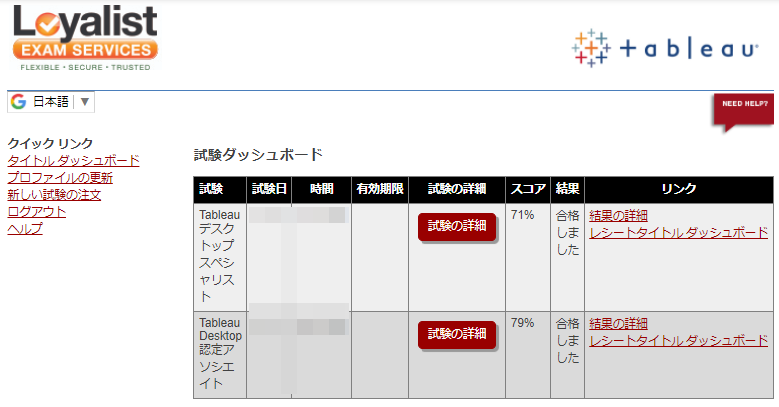

無事合格することが出来ました
Tableau Desktop Specialistで一度学習していたので、記載した無料動画やオンラインヘルプを見ながら、覚えていないところは実際に操作するだけで合格出来ました
試験結果は、受験終了画面でも確認出来ますし、反映まで少し時間は掛かりますが、Loyalist Exam Servicesの画面でも確認出来ます

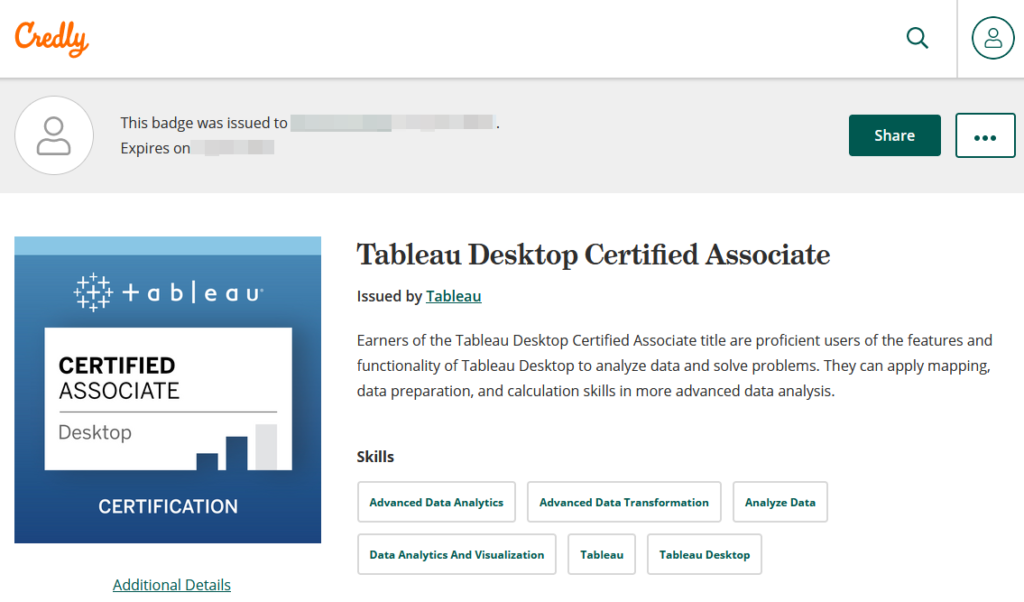
Tableau認定資格は、Credly(旧Acclaim)の対象資格になっています
なので、他のベンダー試験の様と同様に、Credlyで登録も出来ます

Associateは2年の有効期限付きなので、Expires Onの記載が・・・
2年もすればかなり機能更新もされているので仕方ないですね

[スポンサーリンク]

[スポンサーリンク]
▼オンラインで、初心者のプログラミングへの挑戦も、SE職のスキルアップも▼

コメント

タイトルとURLをコピーしました